Muhammed IlliyasJan. 1, 2025
Data visualization is a crucial part of any data science workflow. It helps data scientists and analysts understand data better and communicate their findings effectively. Among the many tools available for visualization in Python, Matplotlib stands out as one of the most versatile and widely used libraries.
A complete Python library for producing static, animated, and interactive visualizations is called Matplotlib. Initially released in 2003, it has since become a cornerstone of the Python data science ecosystem. Matplotlib provides an object-oriented API for embedding plots into applications using Python GUIs and supports various backends to accommodate different platforms.
Versatility: Create a wide range of plots such as line plots, bar charts, scatter plots, histograms, and more.
Customization: Modify nearly every element of a plot, from colors and markers to labels and legends.
Integration: Works seamlessly with other libraries like NumPy, pandas, and SciPy, making it ideal for data analysis workflows.
Interactivity: Supports interactive plots, allowing users to zoom, pan, and explore data dynamically.
Extensibility: Offers the ability to create custom visualizations and integrate with graphical user interfaces (GUIs).
Installing Matplotlib is straightforward. You can use pip or conda to add it to your Python environment:
pip install matplotlib
Or, if you're using Anaconda:
conda install matplotlib
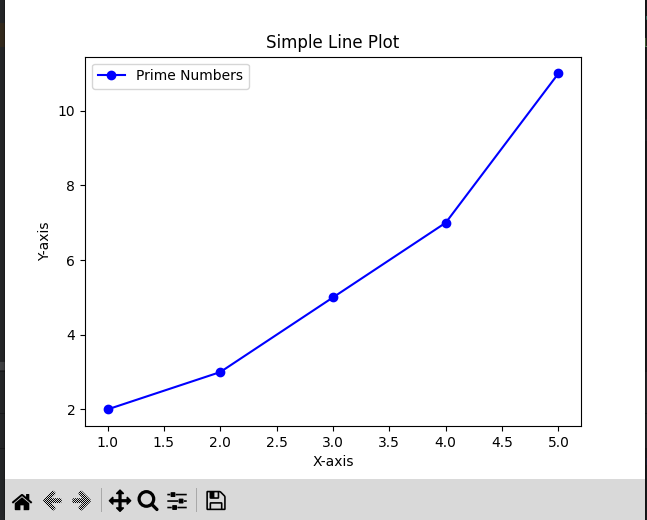
Here is a little illustration of how to make a basic line plot:
import matplotlib.pyplot as plt

# Sample data
x = [1, 2, 3, 4, 5]
y = [2, 3, 5, 7, 11]

# Create a plot
plt.plot(x, y, marker='o', color='b', label='Prime Numbers')

# Add labels and title
plt.xlabel('X-axis')
plt.ylabel('Y-axis')
plt.title('Simple Line Plot')
plt.legend()

# Show the plot
plt.show()

Line plots are excellent for visualizing trends over time or relationships between variables.
plt.plot(x, y)
plt.show()
To compare several groupings or categories, bar charts are utilized.
categories = ['A', 'B', 'C']
values = [10, 20, 15]

plt.bar(categories, values)

plt.show()
The associations between two continuous variables can be effectively visualized using scatter plots.
x = [1, 2, 3, 4, 5]
y = [5, 7, 6, 8, 7]

plt.scatter(x, y)
plt.show()

Histograms help visualize the distribution of a dataset.
data = [1, 2, 2, 3, 3, 3, 4, 4, 4, 4]

plt.hist(data, bins=4)
plt.show()

Subplots: Create multiple plots in one figure.
fig, axs = plt.subplots(2, 2)
axs[0, 0].plot(x, y)
axs[0, 1].bar(categories, values)
axs[1, 0].scatter(x, y)
axs[1, 1].hist(data, bins=4)

plt.show()

3D Plots: Visualize data in three dimensions.
    from mpl_toolkits.mplot3d import Axes3D

    fig = plt.figure()
    ax = fig.add_subplot(111, projection='3d')
    ax.scatter(x, y, [10, 20, 30, 40, 50])

    plt.show()

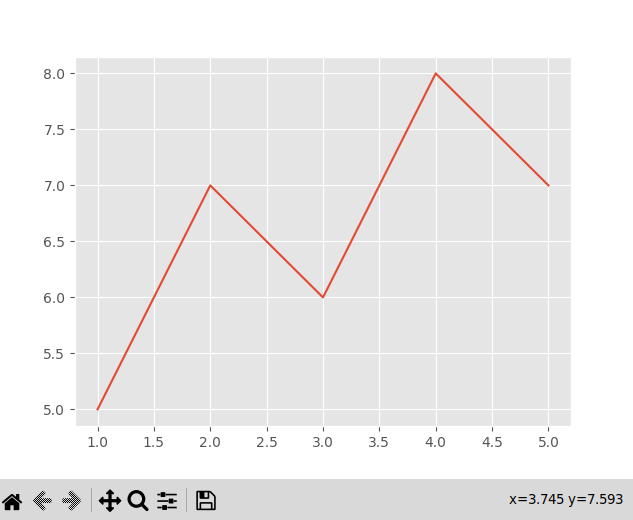
Customizing Styles: Use predefined styles to enhance the appearance of your plots.
    plt.style.use('ggplot')
    plt.plot(x, y)
    plt.show()

Choose the Right Plot: Use appropriate plots for your data to communicate effectively.
Label Everything: Always include axis labels, titles, and legends.
Keep It Simple: Steer clear of overcrowding your plans with details.
Test Interactivity: If your audience needs to explore data, consider adding interactivity.
Matplotlib is an indispensable tool for data scientists and analysts. Its flexibility and compatibility with the Python ecosystem make it a go-to library for visualizing data. Whether you're a beginner or an advanced user, mastering Matplotlib can significantly enhance your ability to present data insights effectively. Start exploring its vast capabilities today and unlock the power of data visualization!


0