Sneha RajMarch 3, 2023
Spreadsheets are one of the most widely used tools in the industry. In spreadsheet, the whole working information of a business may be easily evaluated on a single page. It creates a necessary explicit graphical and data-wise representation of business data efficiently. In Odoo 16 there comes so many new features like making projections, calculating commissions, analyse data, manipulating of data, data can be up to date, highlighting information for easily understand, filtering option, graph option, and decision-making process.

Odoo Spreadsheet can be used by any user in Odoo, there is no restriction on access rights. The feature is based on the ‘Documents’ module. Here we find both a button for creating a new spreadsheet and a workspace where all spreadsheets are stored centrally.
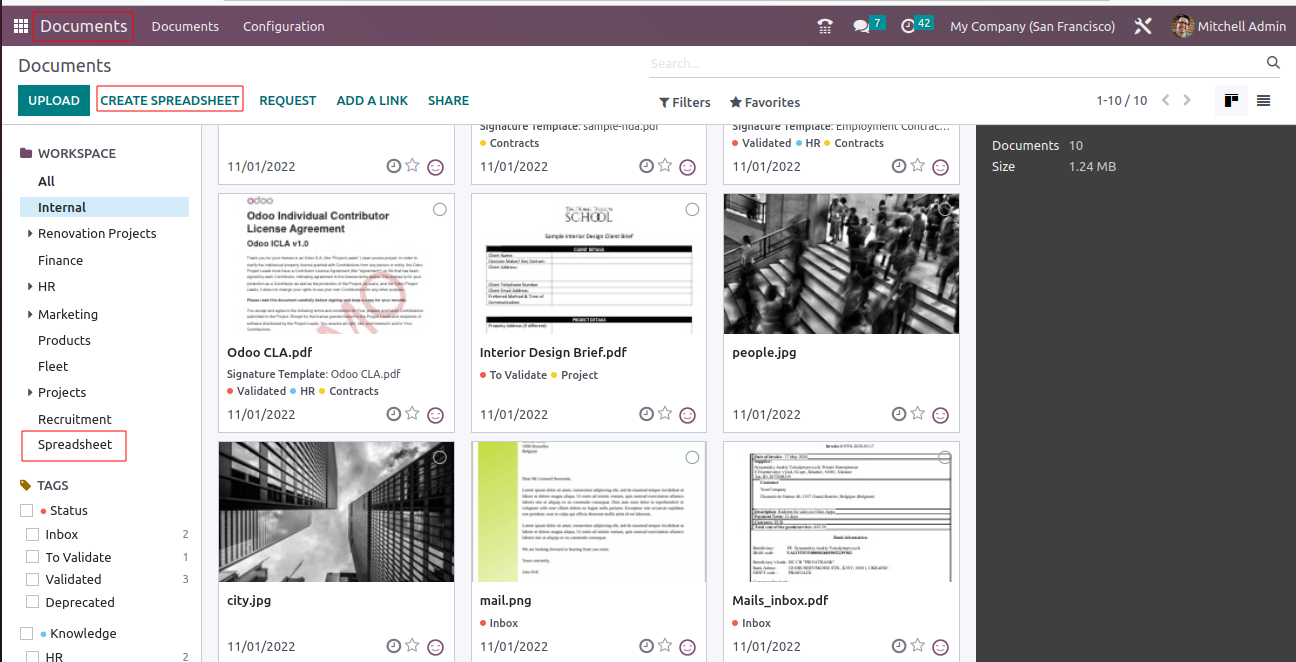
When creating a new spreadsheet, we choose between an empty file or a template.
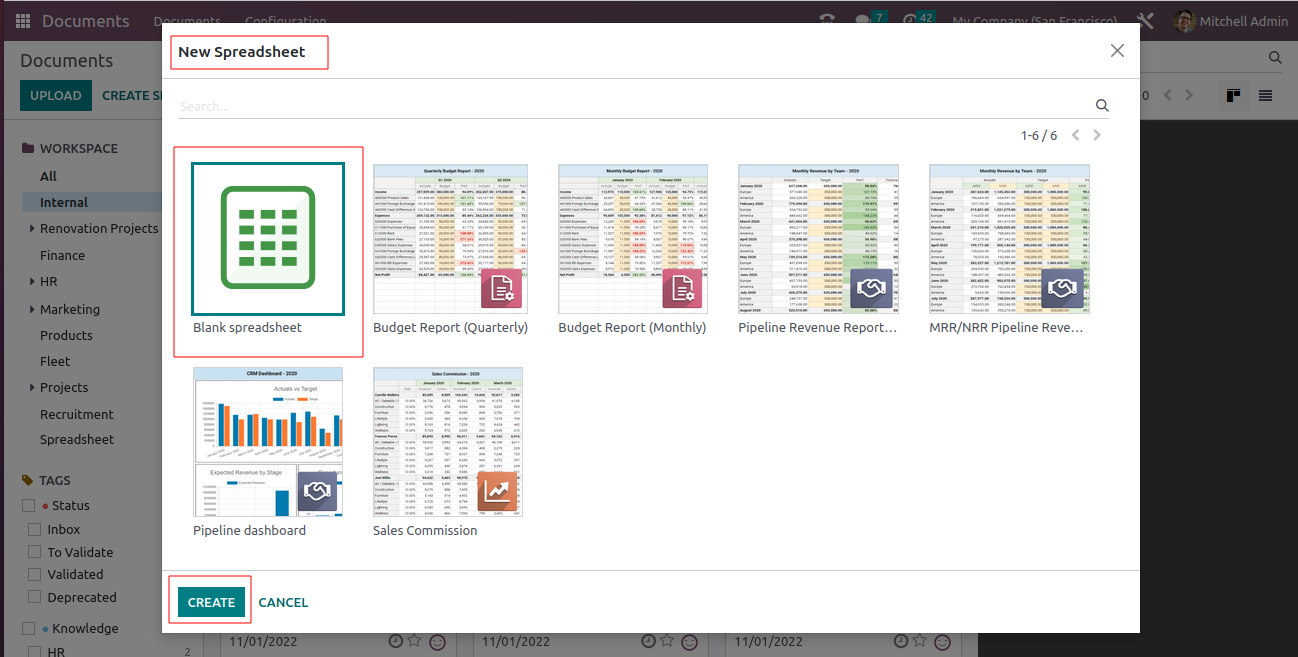
Odoo already comes with some templates by default. In addition, we have the option to create new templates.
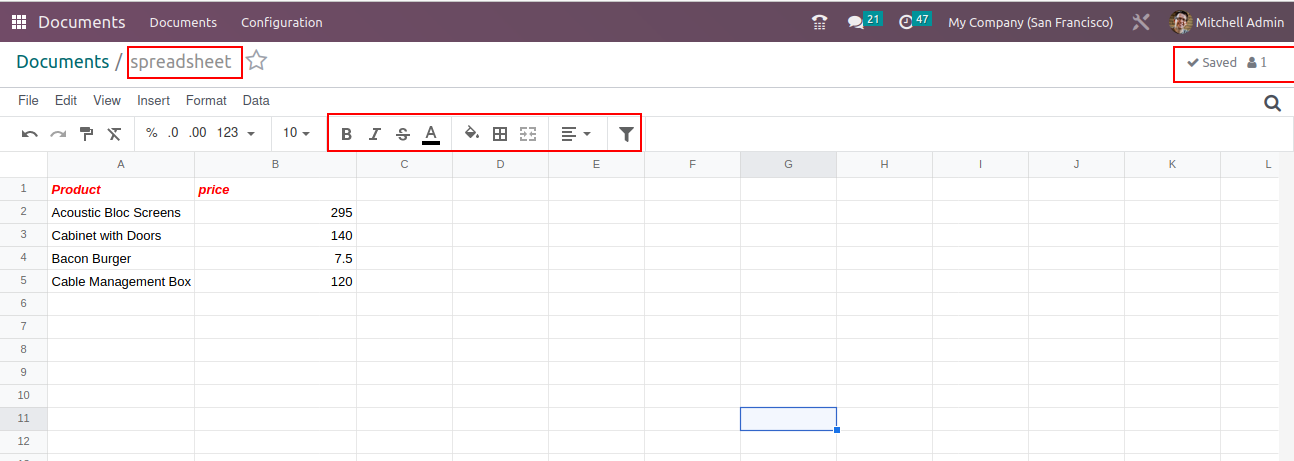
This will open a widget where you can select a template for your new spreadsheet. Select Blank Spreadsheet then click Create button to creating a new spreadsheet. This will open a blank Spreadsheet. Be sure to give a name to the document.
Like most web-based spreadsheet application Odoo spread sheet also have the basic functionality to add new sheets, filter data, format and styling, use formulas, create charts, auto save.
Spreadsheet feature is available in every module or in every reporting system and creates the spreadsheet with the button “Insert in Spreadsheet”.
Odoo 16 Odoo Spreadsheet be accessible in Sales, Point of sale, CRM, Accounting, Invoicing, Purchase, Inventory, Manufacturing, Projects, Timesheets, Helpdesk, Events, Website, Employees, Expenses, and Recruitment modules.
Insert data into a Spreadsheet from these modules. You can create a spreadsheet from data in Odoo wherever the pivot, and graph view are present.
Sales --> Reporting -->INSERT IN SPREADSHEET
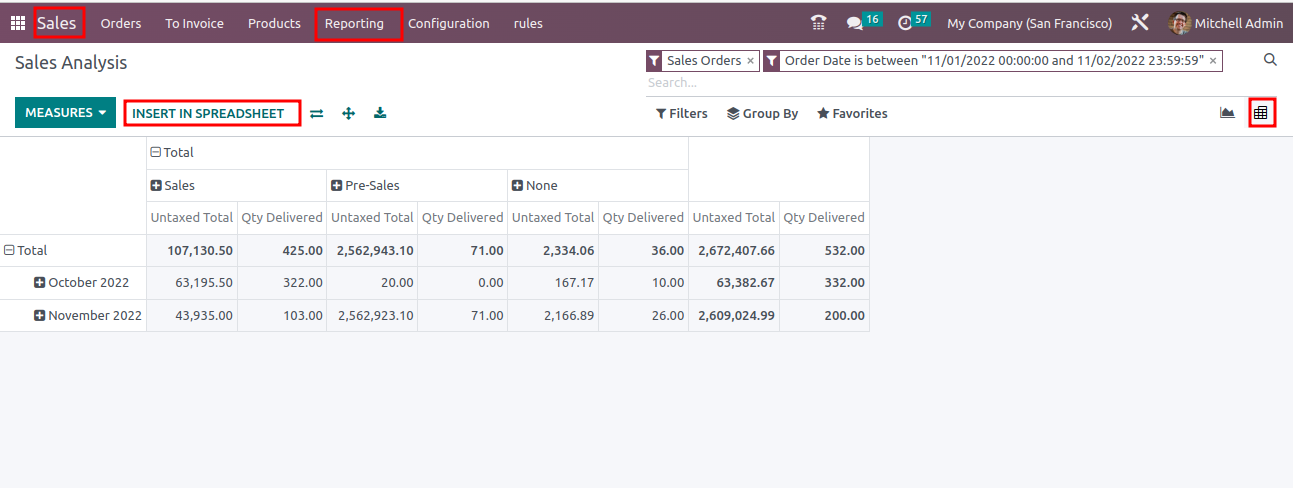
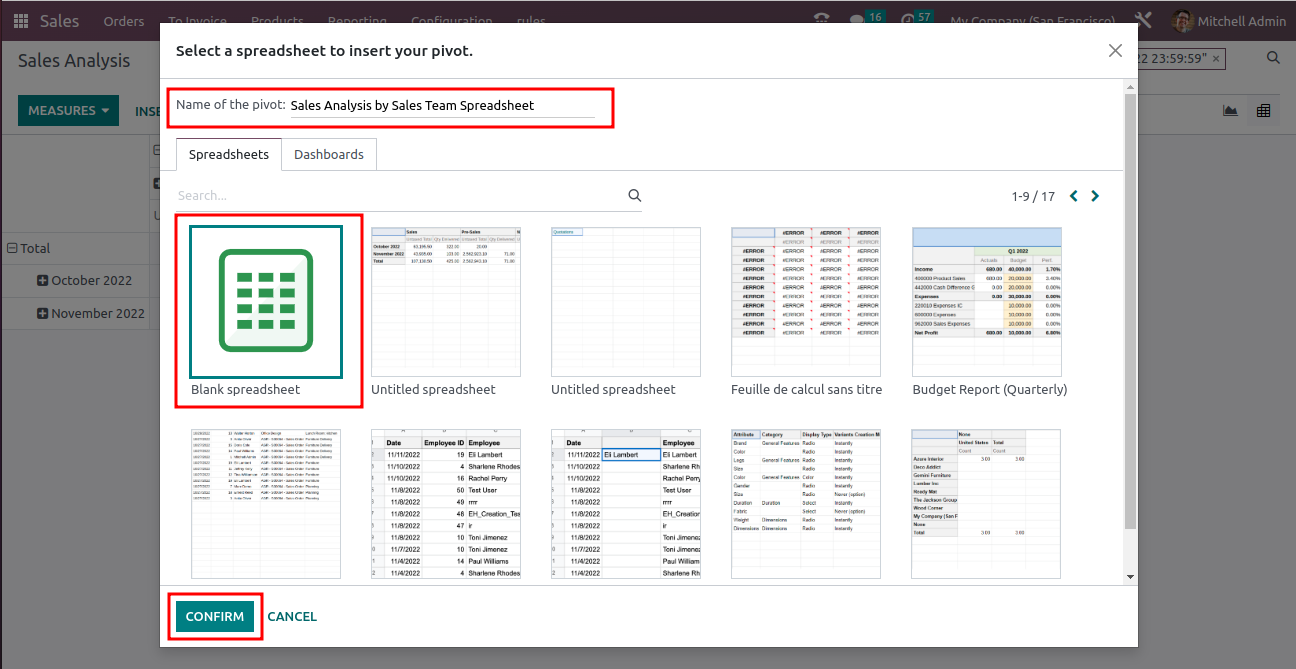
This opens a new widget spreadsheet to insert your pivot table. Selecting 'Blank Spreadsheet' will insert the data into a new document; selecting any other entry will insert your data into an existing document. Then click to confirm the data will display in a new spreadsheet
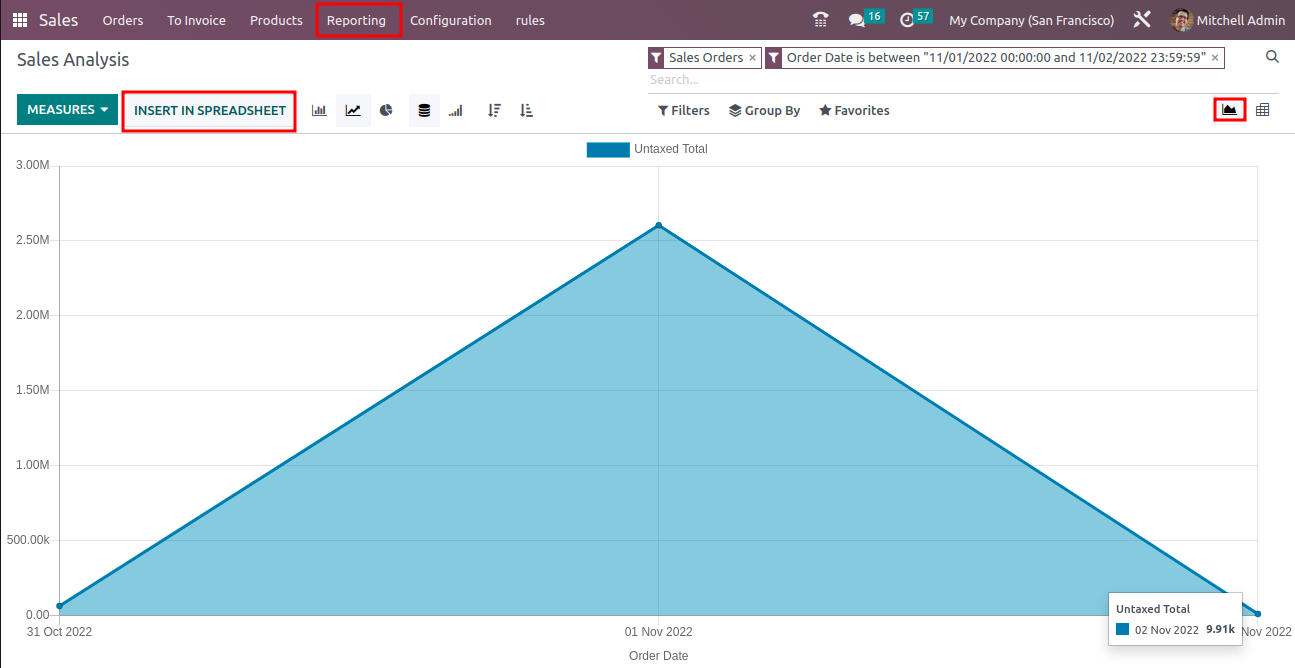
Create New Spreadsheet in Graph view
Reporting -> Insert Spreadsheet
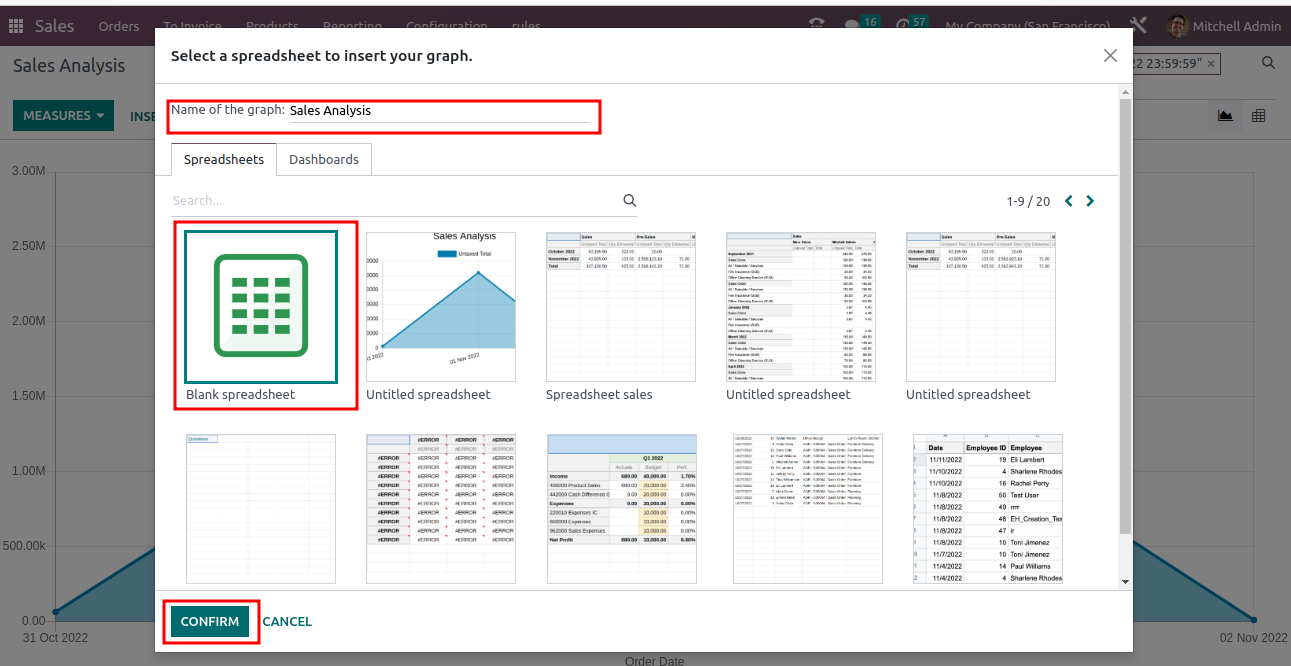
After clicking Insert Spreadsheet add the name of the graph and select any template then confirm.
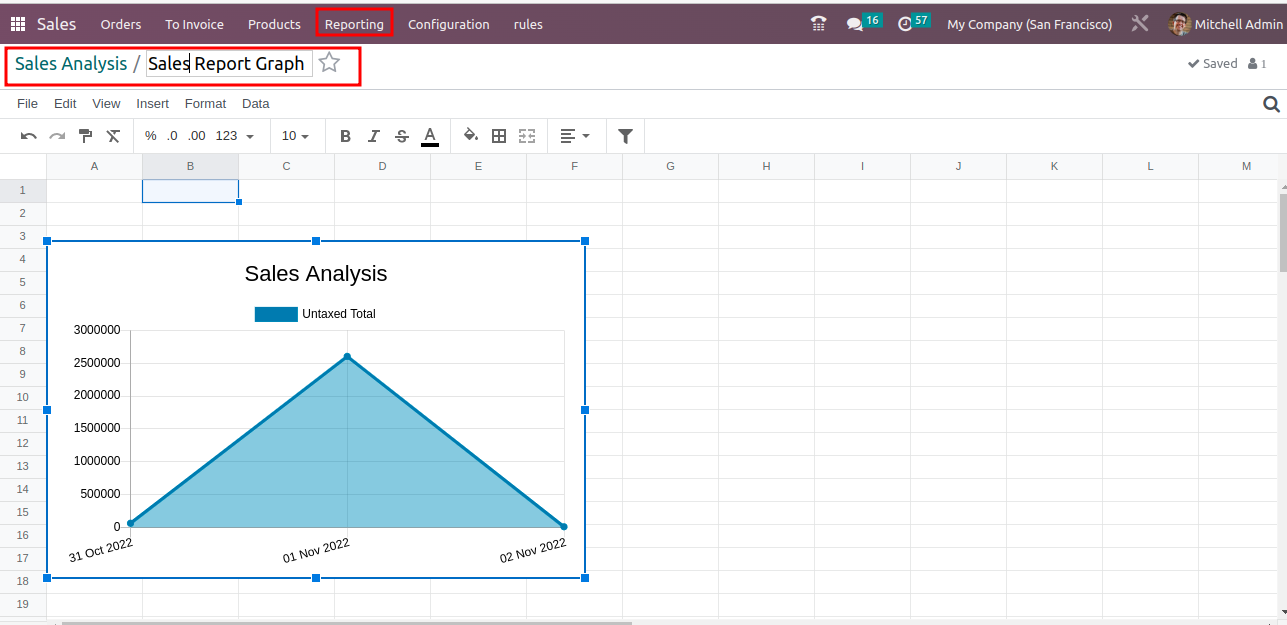
After confirm you can see the graph is created in the spreadsheet.
Freeze Panes
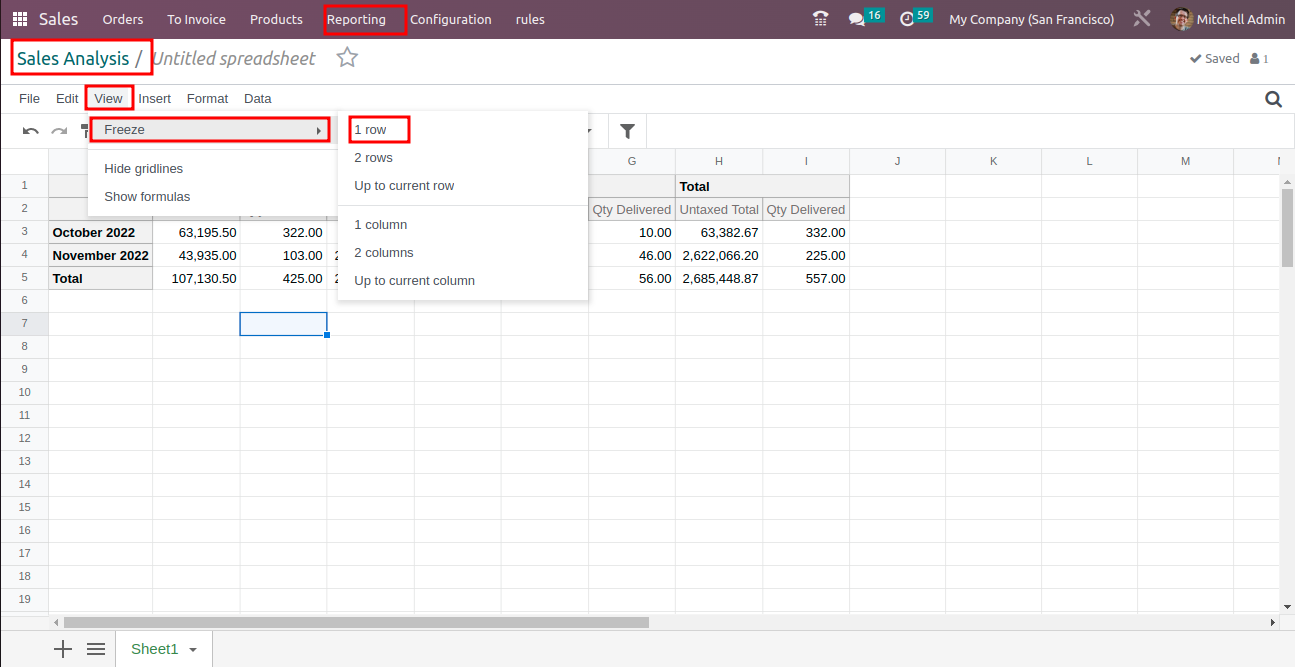
In Odoo 16 can occur a new feature Freeze panes that freeze rows and columns for better readability.
View --> Freeze --> 1 row

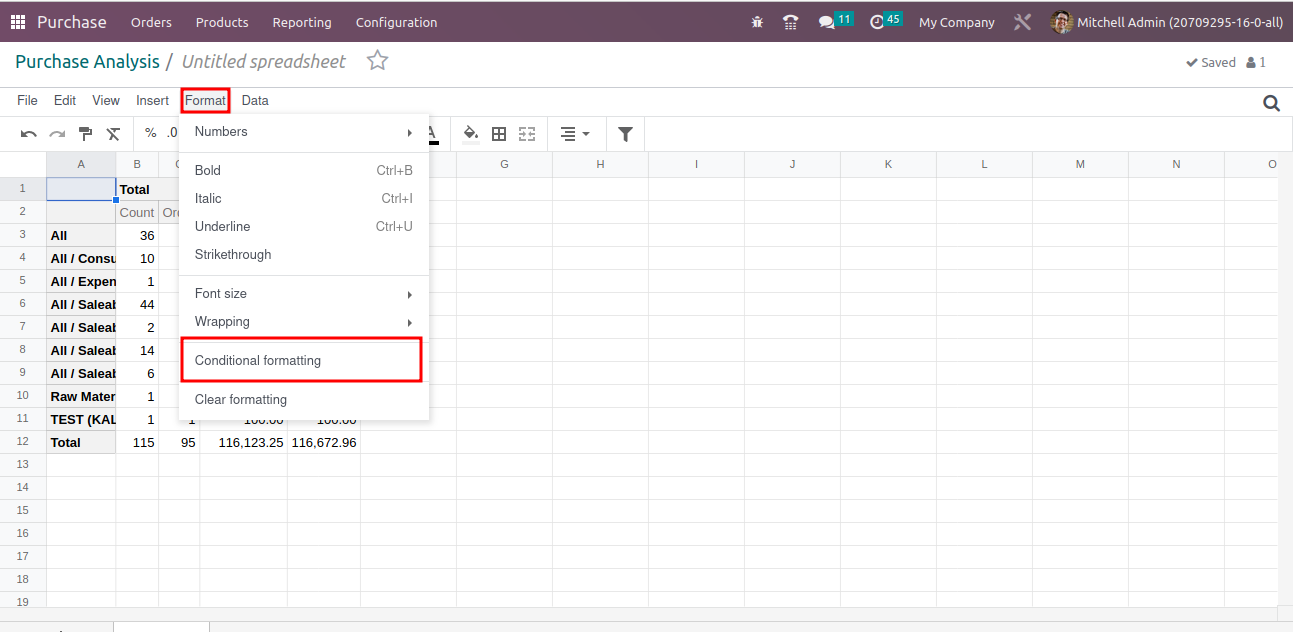
Conditional Formatting
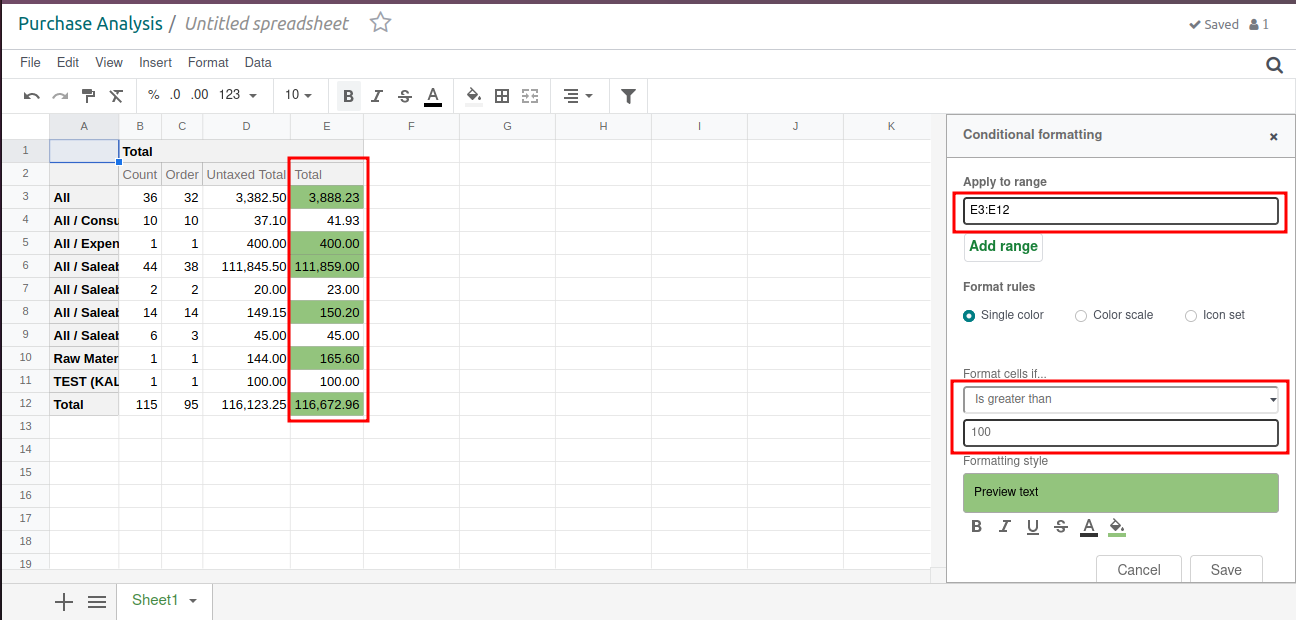
Users can highlight data based on its values. Conditional formatting can be available in the Data menu choose conditional formatting for a new side window display. First add the cell range. It is possible to select the format rules. There are 3 ways to use such formatting. One method is to use a single colour, while another is to use a colour scale or an icon set. Select appropriate icon set from the 3 options available.
After saving, the formatting is performed based on the added condition. The same highlighting can be applied to any other field. While adding new ranges, conditional formatting is also performed.
Also, in Odoo we can manage the priority of conditional formatting rules.
Chart
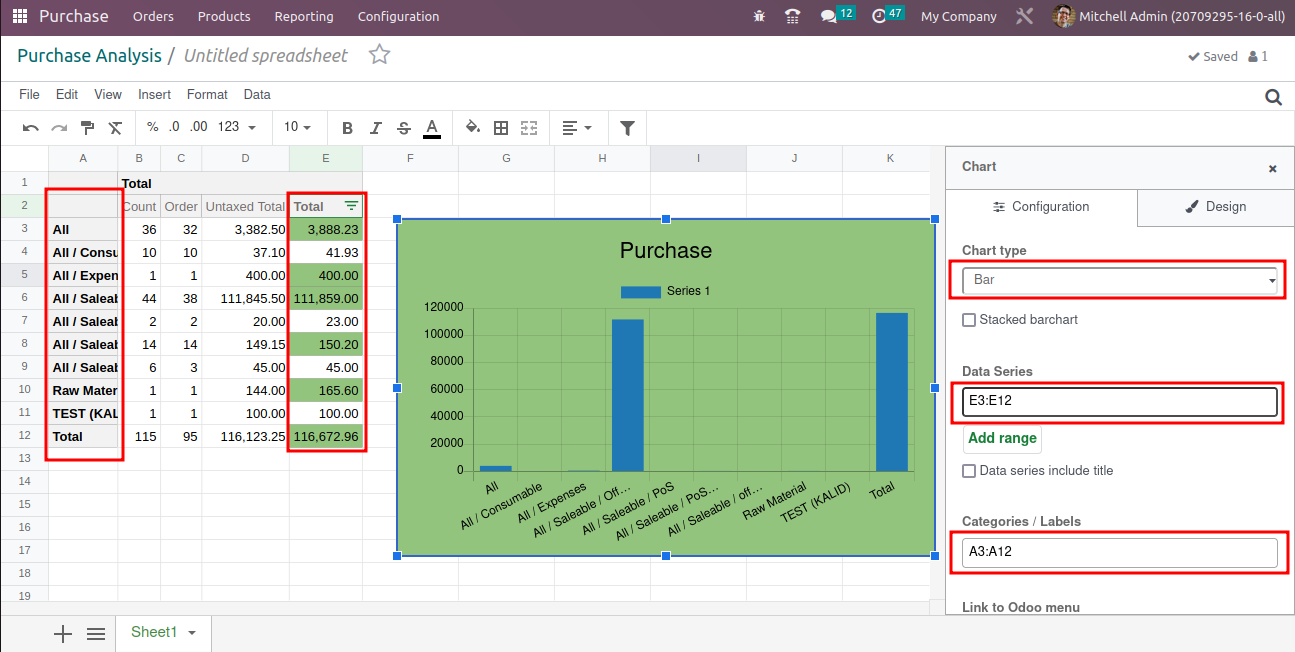
It is feasible to include graph-based analysis. On the basis of specified parameters, the chart can be added. Such graphs can sometimes be more understandable than a long list of numbers.
Insert Chart
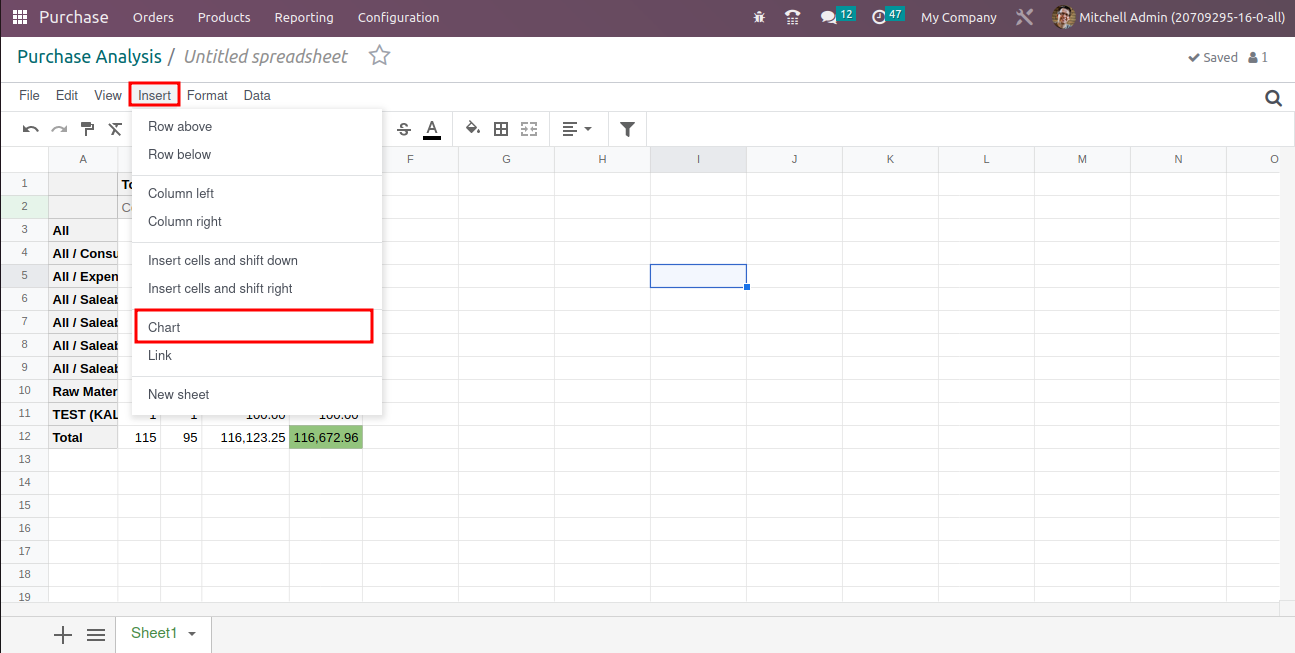
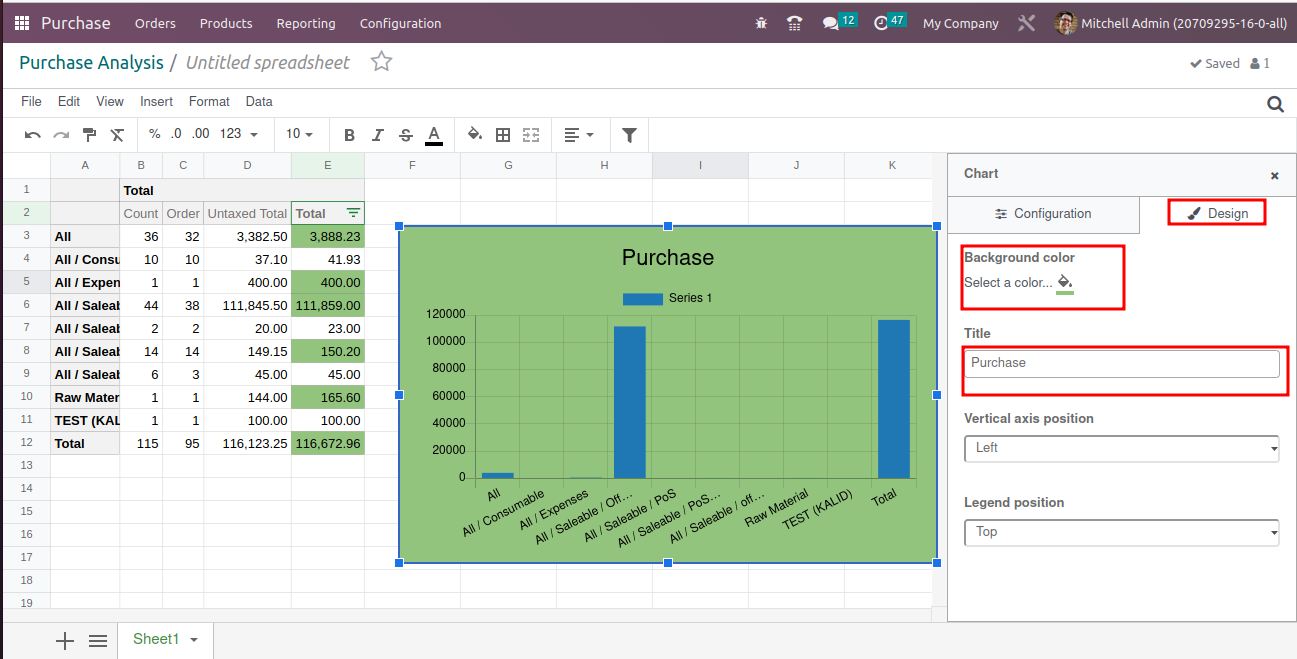
A page is open on the right side and we can add various graph types and parameters to pick from. There are sections for configurations and designs. There are bar charts, pie charts, and line charts.
See Records
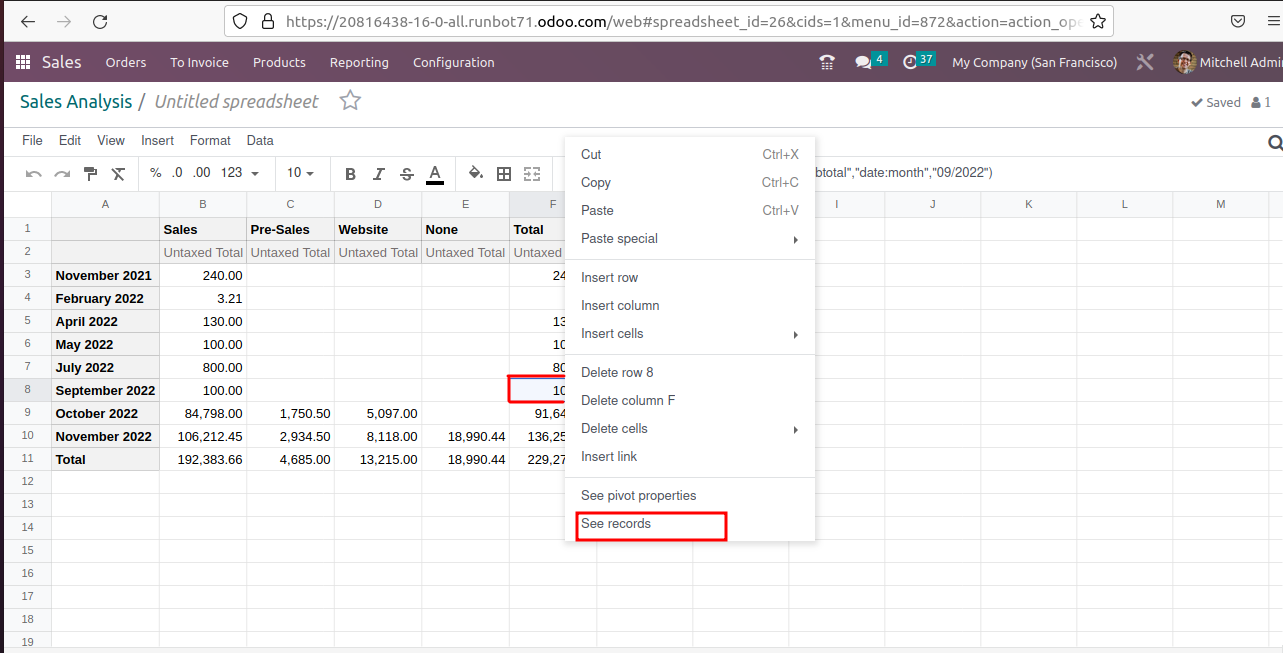
We can see records easily in Odoo spreadsheet by right click the record and select the option see record
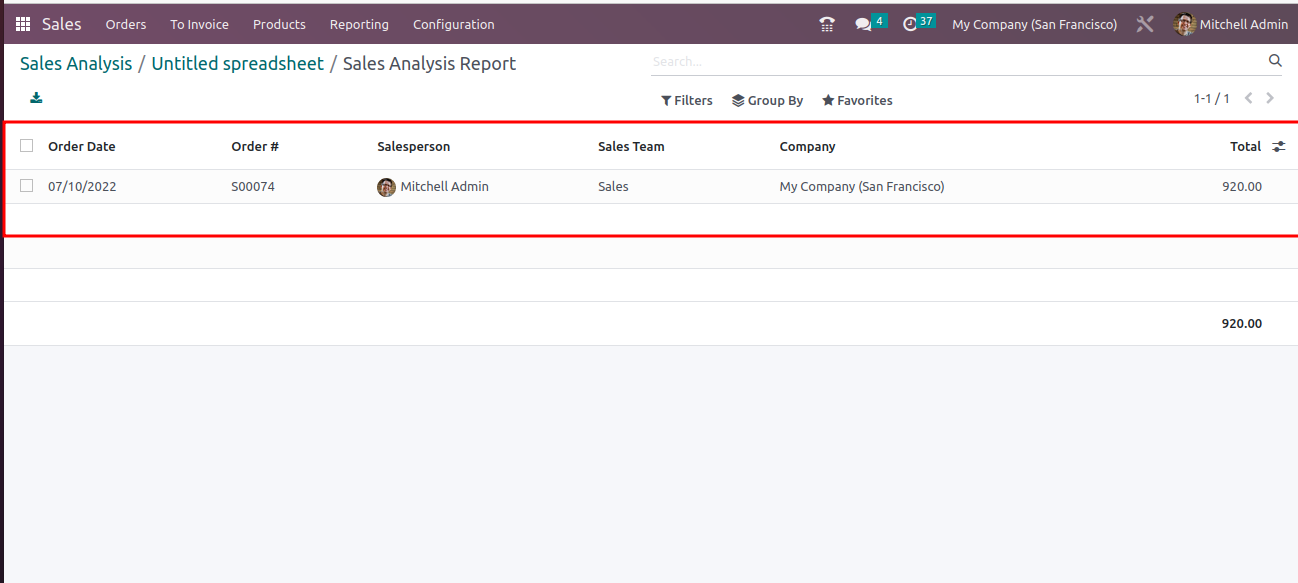
By clicking the see record option it easily redirects to the record.
Insert list data into the spreadsheet
Insert the list data into a spreadsheet easily in Odoo and make an easy comparison of data
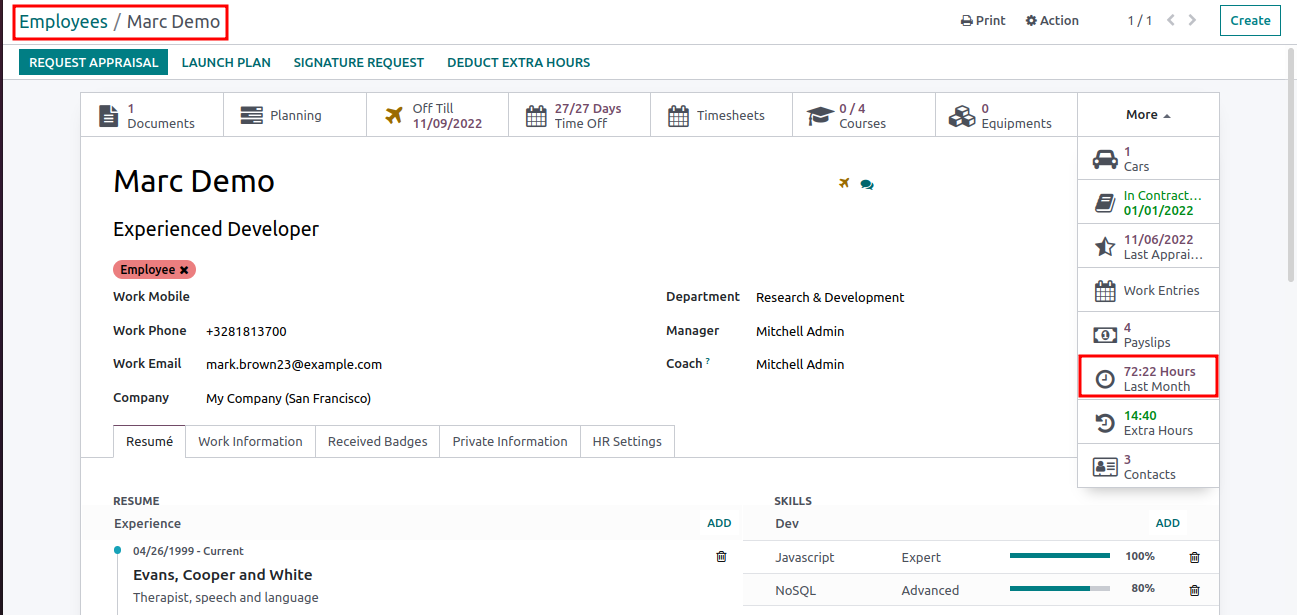
In Employees select an employee and choose the working hours,
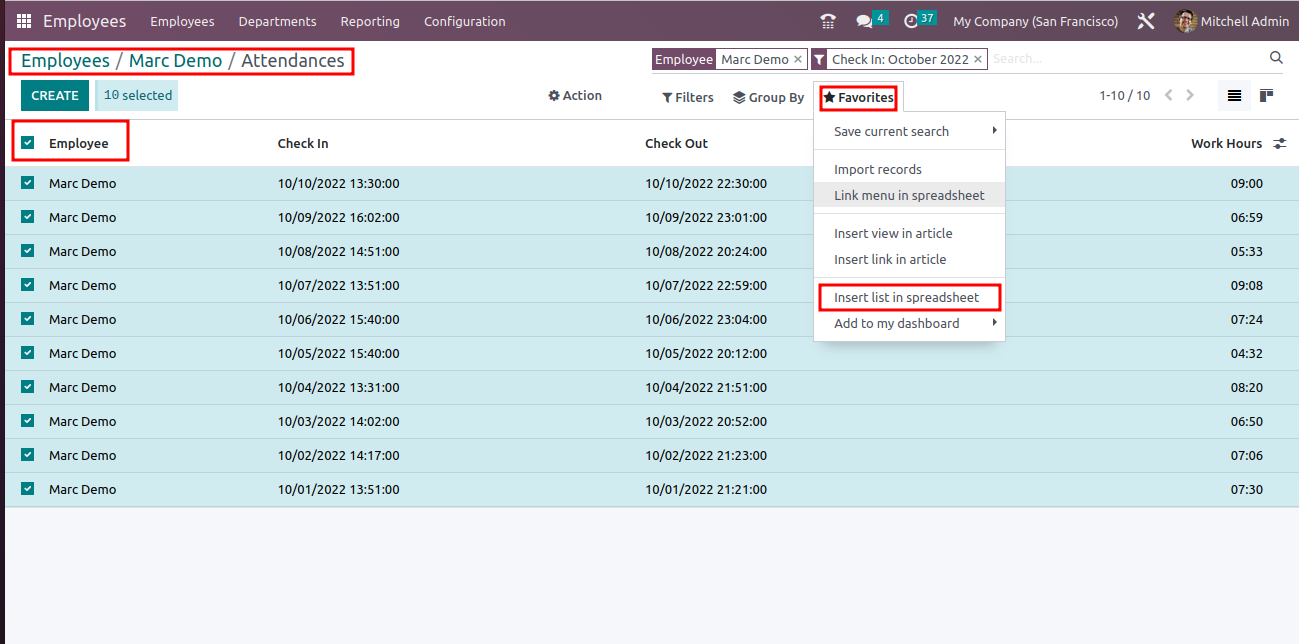
A list view can be opened and select all records then choose the option Insert list in the spreadsheet.
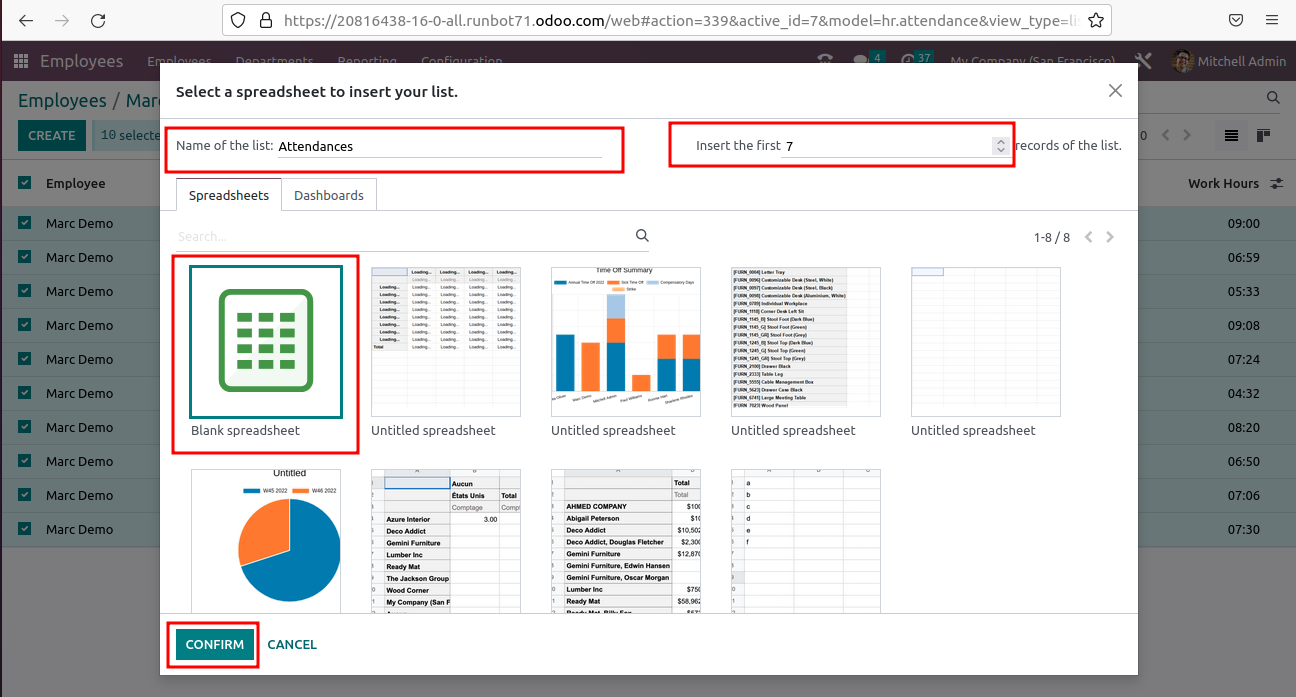
Then name the list, Insert the number of records and select the spreadsheet type and confirm it.
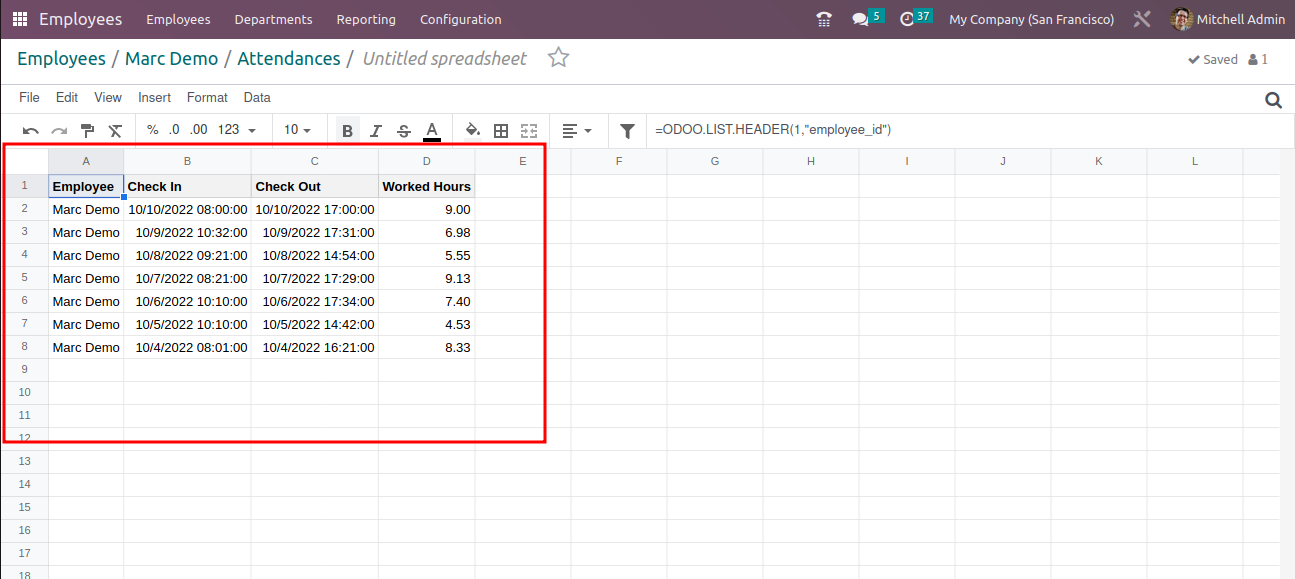
After clicking confirm button the list view created in spreadsheet.
Spreadsheets can be used in different modules they are,
Sales
This allows you to have an easy way of calculating and monitoring your sales reports commission and that’s great because it solves a problem that we had for a long time where the commission is different for every single company and a lot of times people would export it and handle it all in excel or they would spend a lot of money on developing the perfect formulas to build it in and it would cost a lot and of course commission structures change so every time there is a change you’d have to change the formula’s. In Odoo spreadsheet update all real time data and calculations .so it tells you what sale commission is going to be and it’s really easy to edit it and changing it over time so that really helpful.
Accounting
It can use it for budget tracking accounting in Odoo already has a good budget tool but there might be a lot of different kind of budgets that set up and tracking can be done in your own way. It takes over time, so it can be much easier in the Odoo spreadsheet.
Inventory
It set up a spreadsheet that is going to track the shelf life of your certain products and you can see how quickly are certain products moving and how long are they staying. On the shelf over time may be compared warehouse by warehouse.
Purchase
It can be tracking your vendor information you might compare multiple vendors side by side or you might compare vendor prices gradually overtime and seeing how price s are fluctuating on some of the components that you’re buying.
Project
It is really good for various kind of kips because may be all of your consultants
or your people that are working on tasks you have certain goals for them in terms of how many hours that they’re billing per day or may be how many deadlines they are meeting over time so you can set up all sorts of KPI’s and goals in a spreadsheet and then see how that compares over time.
Manufacturing
MRP monitoring the work productivity over time you might be using it to see how many quality checks are passing versus how many quality checks are not passing again setting KPI’s setting goals and seeing how these things shape over time. In spreadsheet can see what kind of things you can figure out and analyse.
Helpful Blog


1